When patients visit health facilities and cannot get the medicines they need, the human cost of a fragile health supply chain becomes clear. For Tanzania’s population of more than 60 million (NBS, 2022), a strong, data-driven supply chain is essential to ensuring commodities are available where and when they are needed.
Since 2013, the Government of Tanzania, through the Ministry of Health (MOH) and the Prime Minister’s Office – Regional Administration and Local Government (PMO-RALG), has made significant progress in transforming health commodity management from largely paper-based processes to increasingly digital systems.
In 2019, Tanzania introduced Bottom-Up Quantification (BUQ), shifting from centrally forecast demand to forecasts generated by health facilities. This strengthened facility ownership, accountability and alignment with national procurement requirements.
Problem Statement
Despite these gains, BUQ reviews remained largely manual, labour-intensive, and error-prone. Healthcare workers reviewed data for more than 101 priority commodities, with facility submissions taking up to 30 days. Council and regional teams manually aggregated submissions from hundreds of facilities in Excel, while the national level reviewed data from more than 8,000 facilities, a process that could take up to 60 days.
The absence of systematic validation also allowed duplicate entries, missing forecasts and other data-quality issues to move through the system unchecked, delaying review and potentially affecting forecast accuracy and commodity availability. In 2022, the availability of essential health commodities stood at 56% (Ruhago et al., 2022), while poor-quality logistics data have been identified as a contributing factor to stockouts (Mathias et al., 2024).
In response, the Ministry of Health, in collaboration with inSupply Health and Afya Intelligence, designed and implemented a targeted intervention to streamline BUQ review, strengthen data validation and support more timely, evidence-based quantification.
Building the tools
The Ministry of Health’s Pharmaceutical Services Unit (PSU), the Prime Minister’s Office — Regional Administration and Local Government (PMO-RALG), in collaboration with inSupply Health, Afya Intelligence, and implementing partners, designed and implemented a suite of BUQ tools which are now integrated into the national eLMIS platform.
The tools aimed to:
- Improve data quality and ultimately forecast accuracy
- Reduce manual workload across all health system levels
- Streamline aggregation and review processes
- Strengthen visibility into forecasting gaps
- Accelerate BUQ approval timelines
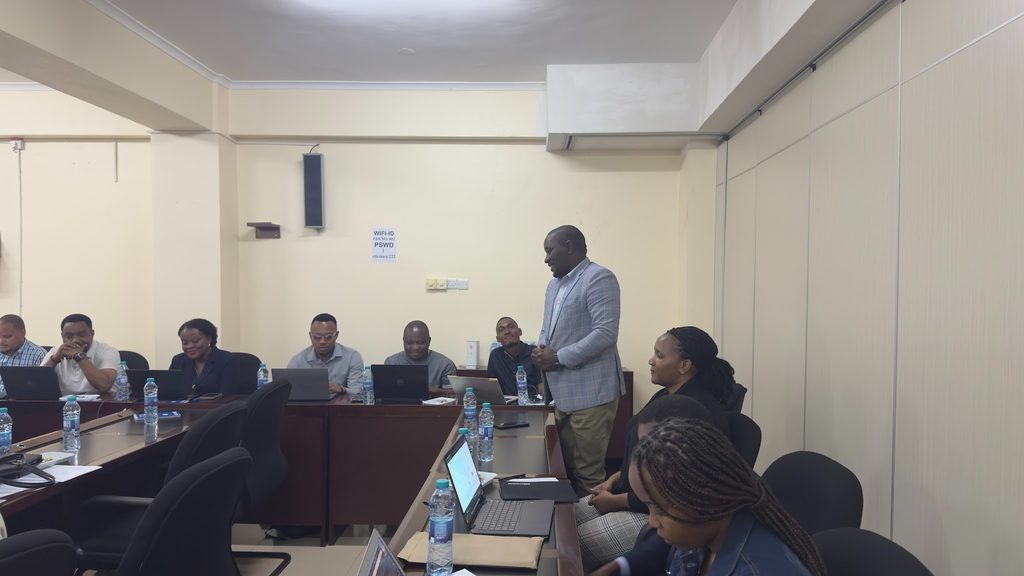
The development of the BUQ support tools followed a user-centred and iterative approach, a methodology deliberately chosen to ensure the tools would be practical, relevant, and sustainable for the users they were designed to serve. A series of workshops and structured meetings were held to gather user requirements, which were subsequently validated with end users to confirm they accurately reflected real operational needs.
The first version of the validation tool was pilot tested in December 2024. The pilot revealed limitations in handling large and complex datasets, prompting further refinements. Continuous improvement efforts throughout 2025 significantly enhanced system performance and usability. The eventual integration of the tools into the national eLMIS platform marked a critical milestone, improving accessibility, adoption, and long-term sustainability.
What the Tools Do
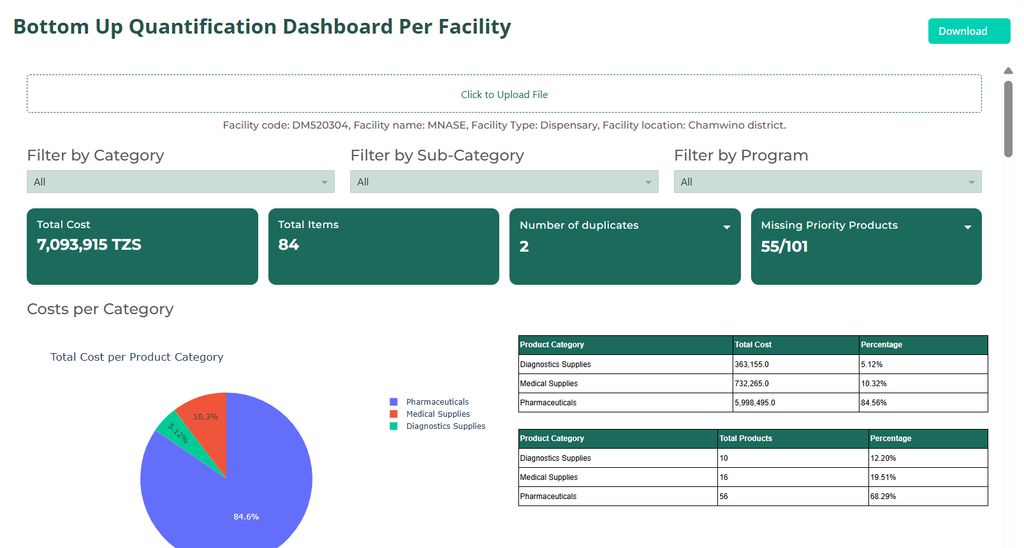
At the facility level, healthcare workers can validate their BUQ submissions before they are finalised and submitted. With a single click, the tool enables facilities to:
- Identify priority health commodities that have not been forecasted
- Flag commodities that have been duplicated in the forecast
- Compare the forecasted health commodities and actual consumption
The tool also features an intuitive dashboard that highlights the total costs of their BUQs by product category and the most and least forecasted items by quantity. This improved visibility in cost allows for more informed decision-making and planning.
At the council, regional, and national levels, the tool provides an additional layer of oversight. Users at these levels can identify missed priority commodities by facility type, including national hospitals, regional hospitals, and zonal hospitals recognizing that each facility tier operates with a distinct list of essential commodities. The tool also supports the aggregation and distribution of forecasts by both facility type and health programme, streamlining what was previously a labour-intensive process
Results
Implementation and Capacity Building
The tool was rolled out nationally and integrated into the national eLMIS in July 2025. Prior to the quantification cycle for 2025/2026, several trainings had been conducted to socialize the tool. Between April and July 2025, a total of 2,706 healthcare workers were trained on the use of the BUQ Tool. Participants included 1,699 staff from dispensaries, 972 staff from health centres, 18 staff from Regional Referral Hospitals (RRHs), and 17 Trainers of Trainers (TOTs). The TOTs play a critical role in ensuring sustainability by continuing to train and mentor users within their respective regions and facilities. In addition to in-person sessions, virtual training was organized by regional pharmacists, district pharmacists, and LMS data managers, expanding reach and equipping more healthcare workers with knowledge on how to use the tool .
Furthermore, targeted orientation sessions were conducted for 28 Regional Referral Hospitals and 56 Council Health Management Teams (CHMTs), strengthening ownership and oversight at sub-national levels.
Improved Submission and Approval Rates
The effectiveness of the capacity-building efforts was reflected in the quality and completeness of facility submissions. Regions where training was conducted down to the dispensary level demonstrated particularly strong performance. At the facility, BUQ approval rates reached 70% in Mtwara (288 of 413 facilities), 62% in Dodoma (444 of 714 facilities), 52% in Songwe (175 of 337 facilities), and 46% in Mwanza (381 of 826 facilities), despite the submission process still being ongoing. These results highlight the positive relationship between user training and improved forecasting performance.
Nationally, approval rates improved substantially following the introduction of the BUQ validation and aggregation tools. As of January 2026, the National Quantification Team had approved BUQs from 8,032 of the 8,116 facilities expected to submit forecasts, representing an approval rate of 98.96%. This achievement reflects significant improvements in data quality, forecast completeness, and adherence to national quantification requirements.
Reduced Review Time
The time required by the national quantification team to review and approve BUQs was reduced by 50%. In previous years, the NQT spent up to 14 days reviewing submitted BUQs and compiling data for the presentation of the national quantification to the medical stores department (MSD), the responsible entity for the procurement of health commodities. Following the introduction of the BUQ validation tool, the review period has been reduced from 14 days to 7 days. This accelerated procurement planning and reduced the workload associated with manual aggregation and validation processes. The time savings also allowed the NQT to dedicate more effort to data quality assurance and strategic analysis rather than administrative review tasks. Additionally, the validation tool has reduced the duration of BUQ review meetings, resulting in cost savings. This reduced cost of review meetings is particularly important in the current context of a changing donor landscape, where declining external funding has increased the need for cost-effective approaches to quantification and procurement planning.
Strengthened Forecasting of Essential Health Commodities
One of the key innovations of the BUQ validation tool is its ability to automatically detect essential health commodities that have not been forecasted for in submitted facility forecasts. This functionality improved accountability and ensured that essential health commodities are included in facility forecasts.
By December 2025, only 6 of 8,122 submissions were rejected for failing to forecast essential commodities, indicating that more than 99.9% of facilities successfully included essential medicines and health commodities in their forecasts.
Improved forecasting completeness was accompanied by a substantial increase in the value of the essential commodities forecast. The total forecast value increased from TZS 461.7 billion in the 2024/2025 quantification cycle to TZS 701.0 billion in the 2025/2026 cycle, representing a 51.8% increase. While multiple factors may have contributed to this growth, comprehensive forecasting powered by the BUQ validation tool was a key contributor.
The downstream impact of these improvements is reflected in commodity availability at the facility level. As of March 2026, the percentage availability of all health commodities stood at 89.3%, demonstrating that stronger forecasting practices are translating into a more reliable supply of essential medicines and health products for the population. By ensuring that facilities forecast for all essential commodities, the tool supports more accurate national quantification and procurement planning, contributing directly to this outcome.
Conclusion
The BUQ validation tool has significantly strengthened the quantification process by improving forecast quality, increasing approval rates, reducing review time, and enhancing the completeness of facility-level forecasts. The successful national rollout and high adoption rates demonstrate that digital innovations can effectively address longstanding challenges in health commodity forecasting and supply chain management.
Given that national quantification is heavily dependent on data generated through routine Request and Requisition (R&R) reporting, there is an opportunity to integrate and roll out a validation tool to the routine bimonthly R&R. Strengthening data quality at the point of reporting would further improve forecast accuracy and enhance the overall performance of the health supply chain.
Sustained investment in user training, mentorship, and supportive supervision will be essential to maximise the tool’s long-term benefits and ensure consistent utilisation across all levels of the health system. In addition, the success of the BUQ validation tool demonstrates the growing potential of advanced analytics and artificial intelligence to support public health supply chains.
As countries continue to pursue data-driven approaches to strengthen health systems, the BUQ validation tool offers a scalable and sustainable model to improve quantification processes and ultimately ensure the continuous availability of essential health commodities for the populations that depend on them.
Watch: BUQ Validation Tool: Step-by-Step Guide