The Challenge
Tanzania has been relying on the bottom-up quantification (BUQ) approach for forecasting health commodities since 2019. This facility-led consumption-based approach to forecasting has increased facility ownership, accountability, and contextual accuracy of projected demand. The approach, however, faced challenges in data cleaning and validation, resulting in forecasts that contained many missing items, duplicates, and outliers. Furthermore, forecasts for over 8,000 facilities had to be reviewed and manually aggregated at the council, regional, and national levels. This proved to be time-consuming and required advanced Microsoft Excel skills. Fatigued reviewers frequently missed typographical errors (e.g., entering 1,000 instead of 100, or 29 instead of 19), duplicate commodity entries, and missing priority items. Last but not least, the forecasts did not have unit costs for vertical program commodities. As a result, the projected demand did not always accurately reflect actual demand, leading to stock imbalances, including shortages and overstocks, at the Medical Stores Department (MSD). National assessments and peer-reviewed evaluations of Tanzania’s LMIS and BUQ processes have extensively reported these systemic bottlenecks, emphasizing the urgency for automated analytics and validation solutions.1,2
The Opportunity
To solve the above challenges, the ministry of health(MoH) through the pharmaceutical services unit(PSU) collaborated with the Prime Minister’s Office-Regional Administration and Local Government (PMO-RALG), inSupply Health and Afya Intelligence to implement the Leveraging AI to Enhance Supply Chain Functions for Improved Efficiency and Effectiveness (Phase 2: 2024–2025) project with funding from the Patrick J. McGovern Foundation (PMGF).
A suite of tools was developed to clean and validate data at scale, detect anomalies and outliers, support the aggregation of forecasts, and reduce manual workload for already overburdened supply chain staff. These include the Report and Requisition(R &R) validation tool, the BUQ validation tool, and the BUQ aggregation tool.
The Impact at a Glance
| Category | Impact Metric |
|---|---|
| 👥 Patients Reached: 2.8 Million | |
| 🏥 Facilities Supported | 8,000+ |
| 👩⚕️ Health Workers Trained | 2,700+ |
| 📈 Tool Utilization Rate | 96% |
| ✅ Forecast Approval Rate | 98.9% |
| ⏱️ Reduction in Review Time | 50% |
| 🌐 Integration | National eLMIS |
| 🚀 Future Focus Vertical Program Forecasting | |
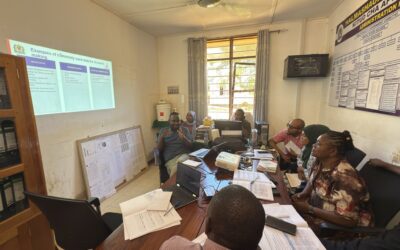
The BUQ validation and aggregation tools were institutionalised by integrating them into the national eLMIS platform. Over 2700 health care workers at different levels were trained to use the tools in person. An instructional video was also shared with those who were unable to attend the in-person training.
Use of the tools proved beneficial for health facility staff, council, regional health management teams, and national-level staff during the 2025 quantification cycle; 96% of those interviewed after the tool roll-out had used them for forecast validation. They reported ease of use and remarkable time savings.
| The tool is easy to understand and allowed me to forecast for some tracer commodities I had forgotten in a short time.” (Health Care Worker, Kilolo) |
| “ I like that the dashboards give me a glimpse of the total requirements in my region.” (Regional Pharmacist, Manyara) |
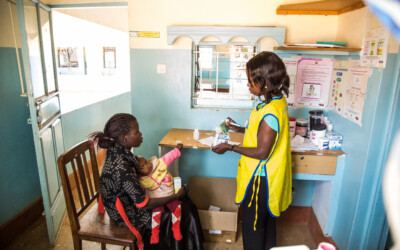
Improved data accuracy resulted in a 98.9% approval rate for demand forecasts from facilities, translating into a 2.8 million-patient reach.
Additionally, the R & R review tool reduced the form preparation time by 50% during the pilot stage.
With the current reduction in funding and the MoH’s move to transition vertical programme commodity forecasting to the BUQ in the 2026 quantification cycle, the BUQ validation tool is being enhanced to support assumptions for vertical programme commodity validation.
Lessons Learnt
Co-creation support: It is important to involve users in the design and development of tools. Co-creation ensures user requirements are met, tools match daily workflows, and is key for buy-in after roll-out.3,4
Institutionalisation of AI-enabled tools by hosting them on government platforms is key to sustained use beyond the project lifespan. For this reason, the integration of the R&R validation tool is now included in the MoH integration roadmap.5
Training. It is also important to train users on the tools through blended approaches, such as physical and virtual sessions. The use of the train-the-trainers (ToT) model is sustainable and cost-effective.
Human-in-the-loop. Finally, validation tools are meant only to assist, not to replace human judgment. The final decision lies with the healthcare worker since they have contextual information.
Conclusion
The project transformed a pilot innovation into a set of operational tools embedded in national systems, reaching thousands of facilities across the Tanzanian mainland and handling millions of data points. By combining a strong co-creation methodology, robust technical design, and deliberate efforts to institutionalize tools within existing platforms, the project has significantly reduced manual workloads, improved data quality, and strengthened the evidence base for supply planning.
References
- Chiwanga MS, et al. Challenges in health commodity forecasting and quantification in Tanzanian public health facilities. Tanz J Health Res. 2022;24(1):45-58.
- Mganga M, et al. Electronic logistics management information systems (eLMIS) and data quality in Tanzania: opportunities and implementation bottlenecks. Health Policy Plan. 2021;36(4):512-20.
- Thomas V, Kalidindi B, Waghmare A, Bhatia A, Raj T, Balsari S. The Vinyasa tool for mHealth solutions: supporting human-centred design in nascent digital health ecosystems. JMIR Form Res. 2023;7:e45250.
- Holeman I, Kane D. Human-centred design for global health equity. Inf Technol Dev. 2020;26(3):477-505.
- Waugaman, A. (2016). From Principle to Practice: Implementing the Principles for Digital Development. The Principles for Digital Development.